This is a total experiment put together today. I wanted to see how I could work with GeoGebra, PowerPoint, Office Mix, and Blogger together. For a first run, I am pleased. Now I can proceed...
Friday, February 13, 2015
Thursday, February 12, 2015
More on NY Regents scaled scoring
The highest value (perfect score) is assigned 100, and the lowest possible is assigned 0. Passing is assigned 65 and passing with distinction is assigned 85. All values can then be converted to the scale using an algebraic transformation:scale score = (a)*(x**3) + (b)*(x**2) + (c)*(x) + d.In this equation, the value of x in each of four equations represents perfect scoring, lowest possible scoring, just passing, or just passing with distinction, respectively. The coefficients can be determined because each equation is set equal to the four known scale values: 0, 65, 85, and 100. These values yield four simultaneous equations. Thereafter, every logarithmic value, which, through equating has the exact same meaning in performance from test form to test form, can be assigned a scale value from 0 to 100 in which 65 is passing. In this way, a logarithmic scale having meaning with reference to achievement of State Learning Standards can be converted to a scale that ranges from 0 to 100 and carries the same meaning with reference to achieving State Learning Standards.
The above is a direct quite from an article written by Gerald E. DeMauro entitled How the Scale Scores Are Calculated for New York State Regents Examinations. (See entire article here). The excerpt does not seem too clear. What non-math people thought about I have no idea. Part of me wants to claim that Mr. DeMauro knew what he was writing about, but the exposition of his knowledge seemed quite cloudy. This article, as posted in 2002, helped feed my skepticism as to what was actually going to happen in New York State.
The Office of State Assessment has a page set up to describe how Regents exams are scored. This page, from 2009, says in its first two paragraphs
In my research on these issues, I came across an article from May 2014 by Gary Stern at The Journal News that stated
With this in mind, I realized I was completely befuddled by the direction NYSED was taking. I am still trying to square up the notion of standards-based testing, whereby all those who meet the standards have succeeded, and the acknowledged politico-economic push to get students through high school by age 18. To have two distinctly different goals such as these is mind-numbing, but to put Mr. Wagner's comments into the mix makes it nearly incomprehensible.
To give credence to Mr. Wagner's words we have the following slide from a June 2014 PowerPoint (find it all here)

Here we have information indicating that no matter how much better or worse performance on exams is, the scaling will get the passing results to conform to 2005 levels. It could seem that the state is telling everybody not to spend too much time with the weaker students, as it will not pay off.
Do not jump to conclusions without reading Determining “cut scores” as New York students take the first Common Core high school exams at Education by the Numbers thanks to The Hechinger Report.
More of my rambling later..
The Office of State Assessment has a page set up to describe how Regents exams are scored. This page, from 2009, says in its first two paragraphs
The last two words here surprised me. I searched and searched for what had been "described above" but could not find what was being referenced.Test scoring is a complex process that derives student scores from the number of questions answered correctly on a test, the level of difficulty of the questions and the skills each question measures. The final score on most Regents examinations is not a simple percentage or number of correct answers. Nor is it the same as the raw score – the total number of points a student achieves on a test.The New York State Education Department develops Regents examinations in accordance with the procedures for test development that are recognized by the American Education Research Association, the American Psychological Association, and the National Council on Measurement in Testing. All major test developers, including SAT, NAEP, and AP, use these procedures and insist that all tests must be scaled as described above.
In my research on these issues, I came across an article from May 2014 by Gary Stern at The Journal News that stated
The state Education Department plans to set the scoring so that roughly the same percentage of students will pass the tests as in the past."We want to have stability in terms of passing rates," said Ken Wagner, deputy state education commissioner.
With this in mind, I realized I was completely befuddled by the direction NYSED was taking. I am still trying to square up the notion of standards-based testing, whereby all those who meet the standards have succeeded, and the acknowledged politico-economic push to get students through high school by age 18. To have two distinctly different goals such as these is mind-numbing, but to put Mr. Wagner's comments into the mix makes it nearly incomprehensible.
To give credence to Mr. Wagner's words we have the following slide from a June 2014 PowerPoint (find it all here)
Here we have information indicating that no matter how much better or worse performance on exams is, the scaling will get the passing results to conform to 2005 levels. It could seem that the state is telling everybody not to spend too much time with the weaker students, as it will not pay off.
Do not jump to conclusions without reading Determining “cut scores” as New York students take the first Common Core high school exams at Education by the Numbers thanks to The Hechinger Report.
More of my rambling later..
Tuesday, February 10, 2015
So the score is scaled...
Here is an Excel plot showing raw score on the January 2015 New York State regents in Algebra One (Common Core) at the bottom, and the scaled score (out of 100) to the left. The dividing spots for New York's 5 "Performance Levels" are given.
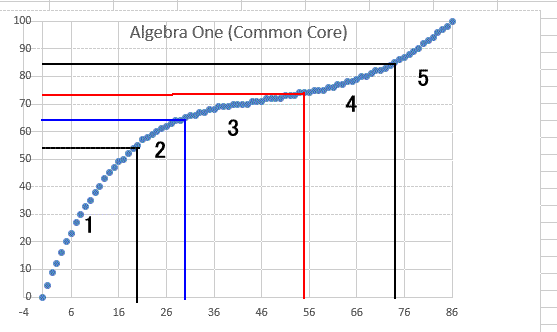
The 5 groups are described as such (from here:)
- NYS Level 5 Students performing at this level exceed Common Core expectations.
- NYS Level 4 Students performing at this level meet Common Core expectations.
- NYS Level 3 Students performing at this level partially meet Common Core expectations (required for current Regents Diploma purposes).
- NYS Level 2 (Safety Net) Students performing at this level partially meet Common Core expectations (required for Local Diploma purposes).
- NYS Level 1 Students performing at this level do not demonstrate the knowledge and skills required for NYS Level 2.
Take note here, the New York State Education Department established in May, 2011, that "the local diploma option remains available to all students with disabilities provided they earn a score of 55-64 on one or more required Regents examinations." (see here) The state has a clearly established goal of getting these students to level 2, thus the steepness of the blue in region 1 above makes political sense.
Naturally, this quick run to level 2 needs a compensatory move in the opposite direction, but not too quickly. In this case, the state makes group 3 a narrow group. Raw score 19 means level 1, raw score 30 means level 3. That is the narrowest band on the raw score scale. A quick jump from "failure" to get over the "safety net." All students at level 3 get the same New York State credit that level 5 students get.
Once we begin the transition from level 3, we have to "toughen" up things. The minimums for Regents Diploma or Advance Regents Diploma require a score of 65 (scaled scores). To get "with Honors" tagged on, a student must average 90% on all required Regents exams. To get to scaled score 90 on this exam is a massive leap from getting that 65.
The bulge at the low end requires a lessening rate of increase as we move to the higher end. In this case the rate decreases enough to create a concavity shift in region 4. This created the opportunity for a "finishing lap" in level 5 that conforms more closely to the "percentage score". Divide raw scores at the upper end by 86 and you will see they give results fairly close to the scaled score. This is valedictorian/salutatorian space, and the scaling here probably helps quiet arguments down the line.
Please take note that when New York shifted to its "Regents for all" philosophy, it created a scenario where political economics demanded the tests be easier to pass, yet national and international standards dictated that these tests could not be too simple, they could not be "easy A's". These dual goals are addressed via the scaling above.
Perform a similar analysis on exams since the first math A that had a conversion chart. The data can be found by plodding through http://www.nysedregents.org/.
Thursday, February 5, 2015
Chaos is in the mind of the beholder
It is time for even non-math people to understand the connection between randomness and order.
This triangle results by picking your 3 corner points, picking a starting point, and then rolling a die. If the die comes up 1 or 2, move halfway to point A. If it ends up 3 or 4, move halfway to B; 5 or 6 puts you halfway to C.
Rinse and repeat. Actually, do not rinse, just let it repeat. Again and again and again....
Subscribe to:
Posts (Atom)