Many people seem to think of circles as simple things and ellipses as "oh, that's math and I was no good at it...".
Here is a bit of a perspective on that created in GeoGebra.
If you know nothing of ellipses beyond "oval", start by just using the control buttons at the top. If you are comfortable with ellipses, but a bit of a skeptic, experiment with the sliders as well. If you really want to know what is happening, download the complete file here.
Regardless of where you stand, GeoGebra does give a great dynamic approach to mathematics.
Friday, August 4, 2017
Thursday, August 3, 2017
math is an exploration!
Any study worthy of its name involves decoding and analyzing and learning from the work of others. A high school trig student has all the math skills needed to create a file like this. A lower grade student might be encouraged to learn about sines and cosines due to their "hidden" use here.
At worst: it's a a neat design! (find the file here.)
At worst: it's a a neat design! (find the file here.)
Wednesday, July 26, 2017
Let's make mathematics great again...
This is a magical question from the New York Regents Exam in Geometry (Common Core) of June 2016. Based on a NYSED decision, both (1) and (3) are accepted as correct, which means that item III is both always true and not always true. Magic!!!
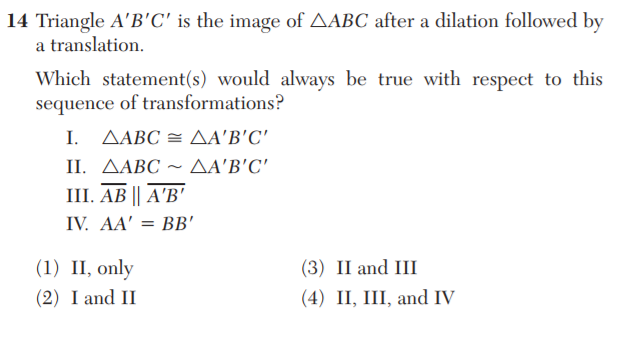

For the visually-motivated. here is a quick GeoGebra file based on this question.. Unfortunately, due to space limitations, I had to put limits on the dilation scale factor and the translation components (computers do not like to accept infinity as a number!)
This question was one of 3 in this exam in which multiple answers were deemed acceptable (after initial scoring, grading, and graduations were all over.)
I have two concerns over this fiasco:
- A student seriously confused by question 14 (not be the mathematics) might have, in following the directions to indicate the BEST choice, left the answer blank. That would have been correct, as there cannot be multiple BEST answers. They would get no credit, yet a student who was clueless and put down a random selection would get credit.
- Many teachers use old regents exams as study/review/practice for exam time. What will NYSED do to ensure that future use of these exams is predicated on information regarding these mess-ups? It is now three questions (14, 22, and 24) on this exam that have been acknowledged as invalid.
Be aware that on question 14 two answer selections are accepted as correct, on question 22 all 4 answer selections are being accepted as correct, and on question 24 all 4 answers plus a blank are being accepted as correct. See these links: question 24, questions 14 and 22
Wednesday, July 19, 2017
June 2017 NYS Geometry Regents Question 24 has no correct answer!
July 25, 2017 note: I have just received word that NYSED has deemed all 4 answers to be granted credit for this question.
Here is a question from last months new York State Regents Exam in Geometry (Common Core)
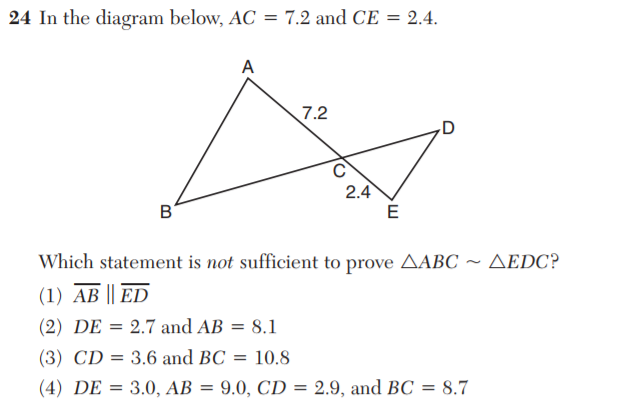
This question, to be answered best, requires you to identify three which are sufficient. The one left over would be the answer. Wouldn't it?
The Regents "powers that be" have decreed that choice "2" is the correct answer. They are wrong. There is no correct answer: all 4 choices are sufficient for the task.
A key item in analyzing this question is recognizing that point C in the diagram is between points A and E and between points B and D. This information is embedded in the diagram. Should a blind student be taking this test, this information must be verbally communicated (maybe using the sense of touch is possible, but I will not deal with that here.)
If the diagram has been totally omitted from the question, all bets are off. As a matter of fact, a better question would have been to leave out the diagram and leave out the word "not" in the question.
Although this does not constitute a proof, it illustrates what a proof for choice "2" would be dealing with. I did not use the same point names, but the lengths are correct. Points A, B, E can be dragged.
A more detailed proof has been written and the link can be found at https://www.change.org/p/nysed-mark-q-24-on-the-june-2017-geometry-regents-as-correct
Monday, July 10, 2017
Learn something new...
Math students (or anybody, for that matter) should try to learn something new everyday.
This might help meet that need for somebody out there.Saturday, July 8, 2017
Meanderings on a rainy afternoon
Just a bit of doodling in Geogebra, trying to keep from getting mentally rusty.
Students should be working with GeoGebra.
It's free, it's fun, and it's educational. A trifecta.
The file can be found here.
Students should be working with GeoGebra.
It's free, it's fun, and it's educational. A trifecta.
The file can be found here.
Friday, July 7, 2017
Cavalieri's What?
Here is question 27 from the New York State Geometry Regents exam of June 2016.
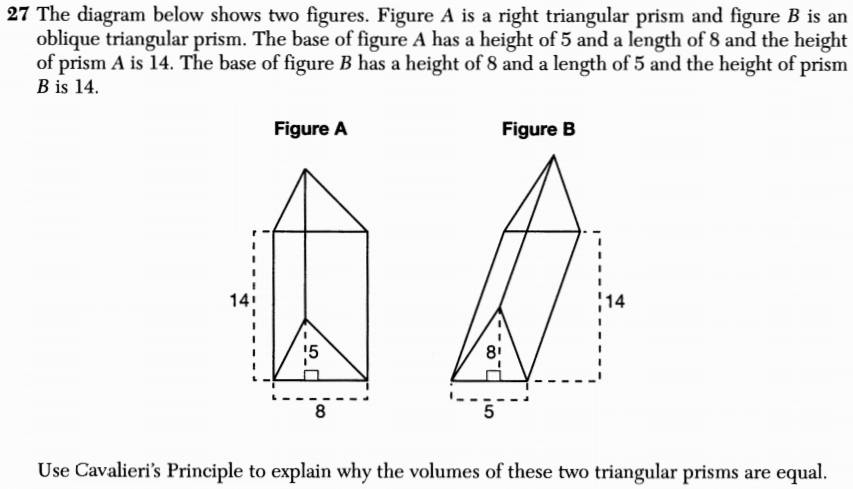
One thing specifically stands out in this question. Cavalieri's Principle.
Students in New York do not have to remember the quadratic formula, how many feet in a mile, or even the Pythagorean Theorem. Those items are all on the Common Core High School Math Reference Sheet with which each student is supplied.
But Cavalieri's Principle? That stands out. After all, everyone should know the main success of Felix Cavalieri, lead singer of the Lovin' Spoonful.
Oh, sorry, Wrong Cavalieri.
This Cavalieri is actually the gentleman who proved the formula for the volume of a general prism (which can be found on the reference sheet).
I will admit that when I first read this question, I said to myself "what the heck is Cavalieri's Principle?" After a little research I was reminded that I had confronted it somewhere in my mathematical meanderings.
It does please me that NY has risen its standards and now expects students to remember and be able to apply Cavalieri's Principle. Now if they could only do that with the other items on the reference sheet...
Wednesday, July 5, 2017
NYS Regents Algebra 1 Questions 18 and 19

The above question bothers me. The statement of the problem makes no claim about any domain, and the answer key's choice of (2) actually requires that the problem be interpreted by the student as a question regarding a recursive sequence. This question appears to result from a mashup of two different issues: recursive sequences on the one hand, and definition of function on the other.
Obtaining the answer that is deemed "correct" requires that the student assume that every result from the formula (normally associated with the concept of "range") can then be used as an input into the formula (normally associated with the concept of "domain").
Although the topics of recursive sequences and function definitions are both legitimate for first year algebra, this question still does not belong.
Here is question 19:
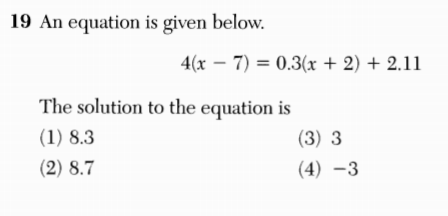
This question can be answered by simple substitution and calculation. A student need show no skill regarding solving linear equations to answer it correctly.
Compare that question to this from Ninth Year Mathematics from 1969 (the one I took)

(The [5,1] indicates 5 points for solving and 1 for checking. ) Admittedly, this question was 1 of 7 ten pointers out of which the student had to answer 4. To see what the choices were, check out the exam here.
For that matter, compare June 1969 with June 2017 and then tell me that our standards have really been raised. (Keep in mind that hand held calculators of any kind did not exist back then.)
Tuesday, June 20, 2017
The Cubic Regression Rules!
The actual exam for the June 2017 New York Algebra 1 (Common Core) has not been released, and teachers are strictly forbidden to communicate via the web on the exam until after June 30, so as I begin my yearly review (as a NY citizen who happens to be a retired teacher), all I can comment on is the conversion chart. Here I have plotted it and included (dotted line if you look closely) the cubic regression curve based on the data contained in the conversion chart itself.
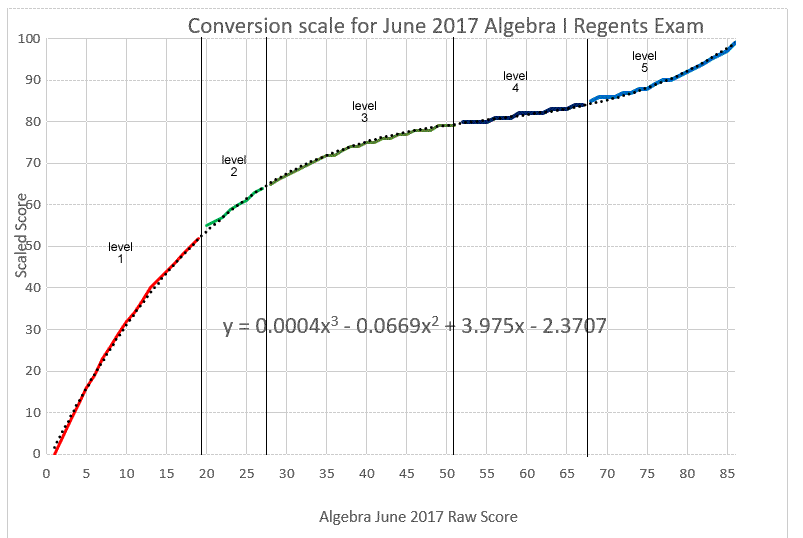
I have always looked at level 1 as the failing range, and level 2 as the "safety net" where Special Ed passes but non-Special Ed does not. That might have changed by now. Needless to say, a regular ed- student has to get to level 3 to be considered "passing"
I noticed that, in comparison to the conversion chart for last June, every raw score from 4 to 21 received a scaled score 1 or 2 points higher this year. No raw score from 24 and up got any boost this year, and a few lost a point on the conversion side.
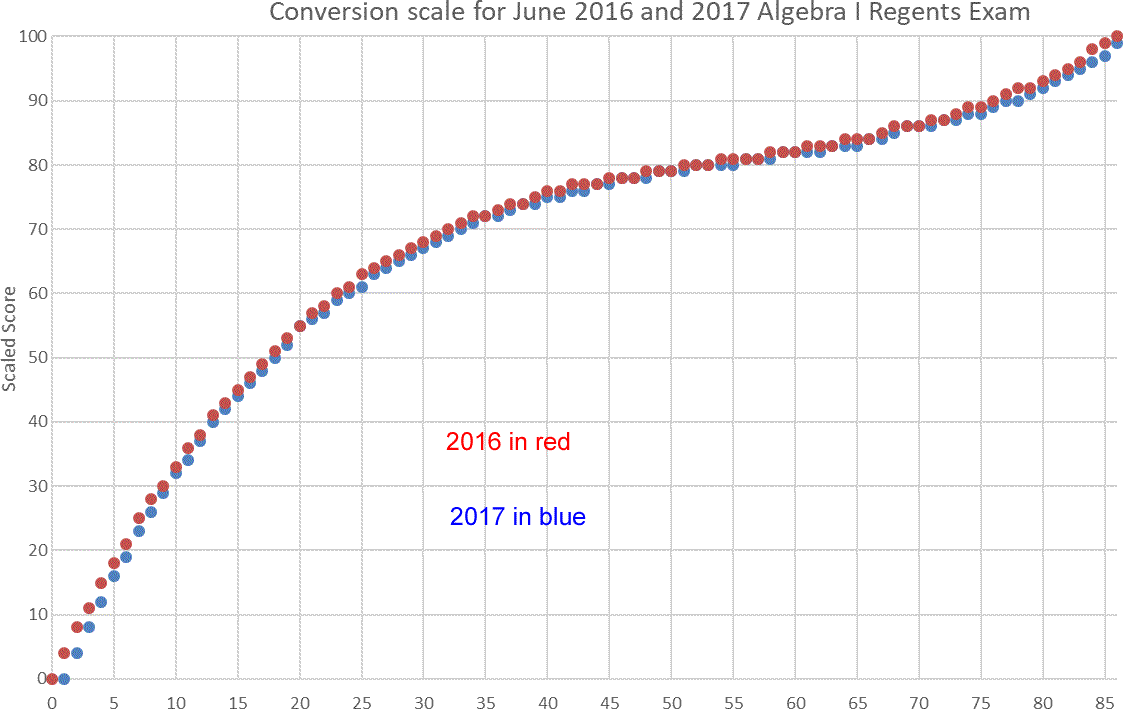
Here are June 2016 and June 2017 plotted together:
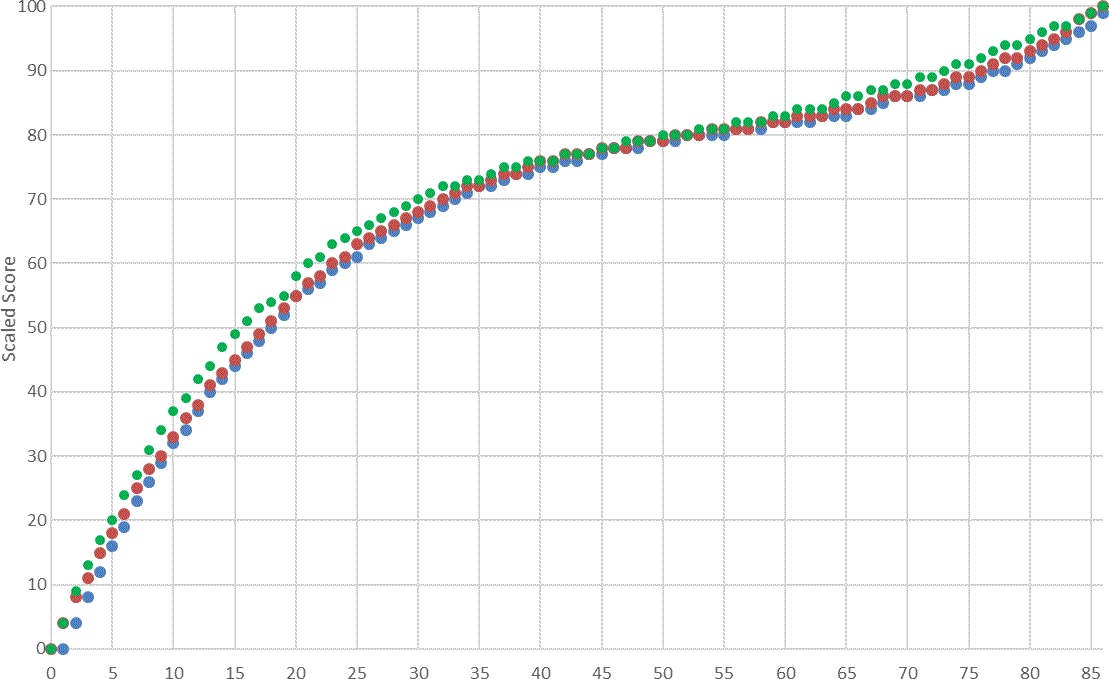
Here I have added (in green) the conversion chart for Algebra II from 2016:
Ever since NYSED started using the raw-score to converted-score approach to scoring these exams, there has been battle between those who liked the old "straight-line" approach and NYSED itself. In case you are wondering, the straight-line approach is based on the concept that if you answer 50% of the test correct, your score is 50. Answer 75% correct, get a 75, etc. If I added the graph of the straight-line approach, it would be a straight line from bottom left (0,0) to upper right (86, 100).
What the heck- here it is:

It is easy to see that almost everywhere the scaled score exceeds the 'straight-line" score, with a minimal gain at the top end, and increasingly large gains as one heads from the bottom towards that magical mystical number known as "65".
I am partially from the "old school". When I took the Regents Exam in algebra 1 (I believe it was properly called "9th Year Mathematics" back then) the exam consisted of 30 short-answer questions (2 points each) and 7 Part 2 ten-point questions, of which you had to answer 4. There was a bit of a top end hammer since a student capable of answering all 7 part 2 questions could get credit for no more than 4 of them. (If a student answered more than 4, only the first 4 answered would count)
Thinking back to those tests, the typical 9th Year Mathematics exam contained a dozen multiple choice questions, each with 4 choices. The random guesser would, on average, get 3 correct out of 12, contributing 6 points towards passing. That student would have to earn 59 points out of the remaining 76. In last year's Algebra I exam there were 24 multiple choice questions, with 4 choices each, so the random guesser would average out with 6 correct, for 12 raw score points. To get to the minimum passing score that student would need 15 out of the 36 remaining possible points. Which is more difficult, 59 out of 76 or 15 out of 36? Hard to tell, recognizing that a student who has to guess on all of them probably doesn't know much of the course.
The other end does intrigue me: the student who gets all the multiple choice correct, be it by guessing or by knowledge or some combination of the two.
In 9th Year Mathematics the multiple choice got you 24 points on your way to a minimum passing grade of 65. In Algebra I last year, the multiple choice gets you 48 points on your way to a minimum passing score of ....27. For that matter, a student who can successfully answer 11 out of the 30 multiple choices gets 22 points. Now that student guesses on the other 13 multiple choice questions will, on average, get 3 or 4 correct. Even at 3, those student now has 6 more points, and has now earned a passing raw score of 28. the student has "passed" the exam without going beyond the multiple choice questions. If that student had guessed by filling in choice 2 or choice 3 for all guesses, he/she had a solid advantage. (There were 5 answers of "1", 7 answers of "2", 7 answers of "3", and 5 answers of "4". I will have to see if it is a trend to put correct choices in the middle slots.)
What does appear to be a trend to me is a trend to make exams in such a manner that passing scores are in easier reach while top scores are harder to obtain. Some may say it appears to narrow the "achievement gap", but appearances can be deceiving.
Thursday, June 8, 2017
Pictures worth 1000 words.
Last week I happened to see a car in Vienna with mathematics all over it. Due to a lot of pedestrians the best picture I could take was of the spare tire case. This picture was taken right near a jewelry store and a Bitcoin store, so in my mind a Tom Clancy novel could start with it. The Casino Wien is just around the corner, the Hotel Sacher is a block away (Sacher of Sacher torte fame). The Vienna Opera is across the street from the Hotel Sacher. The options for starting a novel of intrigue are plentiful. (I erased out the license plate for the privacy of the car owner, although I would question anyone driving a Mercedes covered in math who had a desire for privacy.)

Here is another picture taken, this time in Kunsthistorisches Museum in Vienna. I believe a middle school math lesson could be constructed around these buttons, starting with the task of placing the buttons in numerical order. For some reason the U.S. seems to avoid negative numbers in elevators, let alone decimals. Could there be a greater comfort level with numbers over there "across the pond" than here at home?

Thursday, May 4, 2017
Bezier for Young People
Bezier Curves are generally not confronted by k-12 students at all. Their equations can be complex, and in the absence of dynamic geometry, the topic in general can be mind boggling. Historically, algebra has been the driving force for graphing. With dynamic geometry, that can be reversed.
If you can mentally stomach (how's that phrase?) the idea of a point on a line steadily sliding from one location on that line to another location on that line, you've mastered the necessary skills. Visually, a point sliding from one place to another would look like this:

Being able to picture this is all you need to know. Here it is
Tuesday, May 2, 2017
Jack and Jill
Here is a short Geogebra example I put together as an example of how GeoGebra could be used to introduce young students to mathematics that they might never see unless they got into a precalculus class that included polar graphs.
Among the concepts used (but not named) are midpoint, rotation, rotational speed, and 3-leafed rose.
The only geometric term used is "circle".
Even so, the situation can be used as a springboard lots of questions.
Among those questions could be:
Among the concepts used (but not named) are midpoint, rotation, rotational speed, and 3-leafed rose.
The only geometric term used is "circle".
Even so, the situation can be used as a springboard lots of questions.
Among those questions could be:
- What if they walked the same speed?
- What if Jill walked faster?
- What if they walked in the same direction around the circle?
Denying younger students the opportunity to ask these questions and explore their solutions is to do a disservice to those students.
Thursday, April 20, 2017
Saturday, April 15, 2017
Why? Why? Why?
Here is question 3 from the January 2017 New York Regents Exam in Algebra I (Common Core),

This question shocked me when I first saw it.
To get a taste of what such a correlation coefficient is, I suggest you take a look at Wolfram. New York State's EngageNY has an "introduction" to correlation coefficients (find it here) that says "It is not necessary for students to compute the correlation coefficient by hand, but if they want to know how this is done, you can share the formula" and then shows

It should be noted that this formula the bounds of summation and variable subscripts are omitted, so it is a meaningful formula only for those "in the know", and I suspect that very few Algebra I students fit that description.
Is this a case of presenting a "magic button" on a calculator as a key to answering a complex question? Is that how math should be taught?
New York's modules include the following:

Take note of the phrase "use technology". That essentially means the student should plug in the numbers, hit the necessary buttons, and find a result. It is more like following a recipe, and most people recognize that a recipe becomes unnecessary after it has been followed a number of times: not because it is not being followed and not because it is understood, but because it is remembered.
Here is a question from the August 2016 Algebra I Regents;

I would suspect that after enough repetitions of the recipe some students might have caught on and realized that the choices offered make this question a bit easier than it would have been had the data been a bit different and the choices involved some seemingly random 4-digit decimals. Perhaps that might be why questions such as this have, over the years, been categorized as "cookbook" problems.
The next question here is from the Algebra I Regents exam from August 2015:

There is absolutely no way any student will successfully answer this question without following a recipe on their graphic calculator. I do not know why NYS left all the space on the page as all that is asked of the student is to write down one equation and then a two digit decimal together with one word.
Here is a similar question from the January 2015 Algebra I exam:

The big difference here is the 60% increase in time entering the data (16 values instead of 10) and the explanation of part (b). But again, it's enter two columns of data, hit a couple more keys on the calculator, and read off a result.
A similar process is involved in the next question, the big difference is that it asks the student to pick an item from a different line in the calculator's display:

Do all these questions belong in Algebra I?
Are these items here only because of the lobbying efforts of the companies that sell the graphic calculators?
I would much rather see students get the flavor of least squares analysis by using FREE software such as GeoGebra. For an example, check out the Least Squares Demonstration here.
While correlation coefficient seems to be an easy testable item (when proper calculator is present), it should be recognized that it is merely a measurement of how well a regression line actually "fits" the data. The true mathematical questions begin with the regression line itself: what it is, why it is, why it is useful, when is it useful, how we know it is the "best" fit, what do we do when this is not useful, and many others. For a sense of the current state of regression analysis, just visit Wikipedia.
Please take note: correlation coefficients and a slew of its tag-a-longs could fit in high school mathematics, but not in Algebra I. Dynamic geometric approaches to concepts such as least squares could be well developed in an Algebra I course, using software such as Desmos or Geogebra or other equivalent packages.
The biggest problems with high school mathematics occur when students are expected to know and do things mindlessly. Recipes need to be avoided. Magic buttons on calculators need to be avoided like poinson needs to be avoided.
The true value and meaning of the quadratic formula comes only to one who tires of completing the square. Completing the square obtains its true value and meaning when one tires of trying to find factors (especially when they do not exist!). The real meaning of factoring comes to one who is fed up with constantly having to guess and check. There is a hierarchy to the knowledge and skills of mathematics. Jumping too quickly to a higher level does a disservice to students.
Imagine what would happen if we limited single variable quadratics to finding intersections with the x-axis on a graphic calculator, and skipped over everything mentioned in the previous paragraph! It makes just as much sense as tossing regression analysis into Algebra I only because it can be done on a graphic calculator. Jumping too quickly to a higher level does a disservice to students, especially when that jump takes place largely do to the mere availability of a handheld calculator.
Tuesday, March 28, 2017
Is Kindergarten too old?
Here is a very simple dynamic graph, showing a point sliding down a radius in the same amount of time that it takes the circle to do one rotation around its center. Simple to see and explain.
It is the explanation part that makes this valuable. No matter what grade level, it could be used. From simple use as an introduction to the words circle, radius, rotation, and speed (imagine if children started learning these words in kindergarten) to a PreCalculus class being asked to generate parametric equations so that they could continue the graph on their graphic calculators.
The file itself can be found here.
If you wish to read more about this type of structure, check out this at Wikipedia.
Sunday, March 26, 2017
Be creative in your use!
Here is a sketch that could basically be used with any grade, from a visual with elementary students, to a "can we make it ourselves" with middle school students, to a model for exploration for upper levels.
With an elementary class, I would leave out all the text, and create a step-by-step show, from first circle to tangent line to second circle to midpoint to trace, but not using sophisticated language. With middle school students I would use the basic geometric language and do a step-by-step as well. Upper students who are familiar with Geogebra could be shown the graphic and asked to recreate it. Those unfamiliar could be guided through it. Precalculus students could be challenged to determine an equation that could be graphed on a graphic calculator.
Adjustments to the file are easily made.
The main point is that this technology should not just be used as crutch with old curricula, but should also be used as an avenue for new approaches to mathematics education.
The complete file can be found here.
Tuesday, March 7, 2017
The Magic Formula From Heaven
Here is a statement that absolutely scares me. It is from Lesson 19: Interpreting Correlation from the NYS Common Core Mathematics Curriculum.
It is not necessary for students to compute the correlation coefficient by hand, but if they want to know how this is done, you can share the formula for the correlation coefficient given below.

It demonstrates, in a nutshell, a massive hypocrisy in the implementation of Common Core math here in NY. What starts out, in the lower grades, as a powerful attempt to make students consciously aware of what they are doing, has morphed into the old and disastrous "give them a formula or a calculator and they will be happy." When doing basic arithmetic the emphasis on understanding by expecting multiple methods sometimes seems like overdoing it. Here, understanding is just tossed aside.
Take a look at this Wikipedia page (https://en.wikipedia.org/wiki/Pearson_correlation_coefficient), read it carefully, and then tell me if anything related to this concept actually belongs in Algebra I. If that does not convince you, check out the Wolfram page. For a bit more, check out this one.
What really bugs me is that using a calculator to compute the Pearson correlation coefficient bypasses any attempt to teach understanding. No student will come out of this with any knowledge other than "this is what they told me in school". That is exactly the situation that "teaching for understanding" was supposed to avoid.
Why not let students actually get the opportunity to explore topics such as least-squares regression using software such as GeoGebra? Here is a small visual example of what GeoGebra can do. The labeled points can be dragged and the sliders control slope and y-intercept of the line. The best fit is the line that gets the sum of the squares as small as possible.
We should keep in mind that there is no need to have a line of best fit if we can see all the data plotted in front of us. A best fit line can help us if it can be understood as a model of prediction. If that is the goal, then it would make sense to have some strong connection between the modelling line and the correlation coefficient. Check out what New York State students experience and see if that connection is solidly made.
Wednesday, March 1, 2017
Does mathematics need to be more wordy?
The January 2017 New York regents exam in Algebra I (Common Core) contains a question with a model response that I do not get.
Here are the directions:

Here is the question and the model response:

The student has shown in 2 steps how to convert one equation into slope-intercept form, and you can see that the equation ends up identical to the first equation in the question. In answer to "Is he correct?" the student answers "No." In explanation, he states that the two equations are for the same line.
The model response scoring states: Score 1: The student wrote an incomplete explanation.
Mathematically, this model response nailed it. For some reason it only gets half credit. Was it not verbose enough? Is there a minimum number of words required?
You can see the entire group of model responses here.
Tuesday, February 28, 2017
Is understanding a language too difficult?
Here is a list of words:

- noun
- verb
- adjective
- adverb
- subject
- predicate
- direct object
- indirect object
- clause
- pronoun
I could continue the list, but these will do.
You might ask, so what about these words? In answer, I can state with conviction that the knowledge of these terms, their meanings, and their usages, was key in the development of my personal understanding of our language.
Even though I spent years teaching and learning mathematics, I still use the concepts of adjective and noun when discussing fractions. Many of you might remember the terms "numerator" and "denominator", which are fancy words for the ideas of "how many?" (adjective) and "of what?" (noun).
The simple fraction \({\textstyle{2 \over 3}}\), properly read "two thirds" gives us a quantity (two) and a denomination (thirds), thus answering completely the question "How many, of what?".
This morning I made a discovery: none of these words is used, at all, in the January 2017 New York state regents exam in English Language Arts (Common Core) .
I found that atrocious. How can one even discuss the "art" of language without involving its grammatical structure?
Basing an entire curriculum on grammar would be a waste of time, just as doing nothing but arithmetic under the name of mathematics would be useless drudgery. But to totally ignore grammar amounts to designing a skyscraper while ignoring the hidden structure that holds it up.
Here is question from the New York regents Comprehensive Exam in English from August 1978:

How would students react in this day and age?
I guess it won't matter too much, as long as the gun is around to take care of the grizzlies.
Monday, February 27, 2017
January 2017 New York regents exam question 24 is not nice
Here is a question from the January 2017 New York regents exam in Algebra II (Common Core)
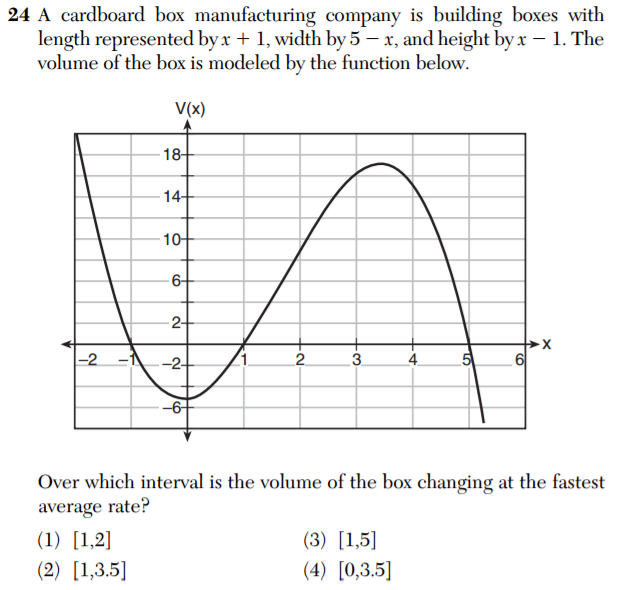

Please take note that, according to the statement, the height of the box is "x-1".
That fact alone is enough to force any modeling function to only use x values larger than 1.
Similarly, the width being "5-x" forces the modeling function to use values for x that are less than 5.
This graph includes values for x that must be excluded, so it is not a good modeling function.
In addition, words such as "fastest" when used without a reference create an implication of time as a parameter. Combine the lack of a time factor in this question together with the issue of a box with a changing volume (the first sentence in the question refers to "boxes" where as the rest of the question refers to a single box), and confusion in the mind of the test taker is to be expected.
This question could have been written quite differently and perhaps have been restored.
When the day comes when these tests can be truly computer-based, a question such as this might be accompanied by a visual such as that shown here:
In the meantime perhaps New York could stop its insistence on testing questions being "real world".
Sunday, February 26, 2017
2017 NYS Algebra II (Common Core) question 5
Here is a question from the January 2017 New York regents exam in Algebra II (Common Core)
 Based on the information given here, this question cannot be answered. If we place the graph of the the linear equation given, we would see this:


We might guess that the point (1,1) is a solution, but without anything regarding function g(x) other than a partial graphical representation, we have no way to check our answer.
Secondly, by the inclusion of choice (4), a guess could be made that the graph given in the question was intended to be parabolic and that the student was supposed to take an educated guess at the coordinates for a few of its points so as to derive a quadratic function. There is nothing in the question to rule out a situation such as this:

The function in red as shown here agrees with everything that is given in the problem. In this case, none of the four choices can be accepted as a solution.
In this question any answer chosen by a student would be incorrect. To expect any student to reason out an answer would be encouraging them to base arguments on unknown information and would be encouraging them to make convenient but unsupported assumptions in the absence of facts.
Monday, February 13, 2017
Wednesday, February 8, 2017
If you do not try to avoid careless errors, will you avoid any errors?
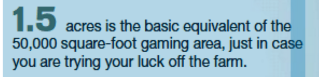
The clip above is from the Albany Times Union from today (Feb. 8, 2017), which happens to be the grand opening day for Rivers Casino in Schenectady, NY. I note a little urban attitude in the clip, with its subtle inference that only farmers would use a measure in acres. That attitude alone does not surprise me, and it could be more my personal attitude showing through. But that is not why I include this clip here.
Read it really carefully, and you will note that its key thrust is that 50,000 square feet is approximately 1.5 acres. To quote our President, "Wrong!!!"
An acre calculates out to 43,560 square feet. I say "calculates out" because it is initially defined as an area of one furlong (660 feet, or one-eighth of a mile) by one chain (66 feet, or one-tenth of a furlong). Do the arithmetic, 66 times 660 equals 43560.
Calculating further, dividing 50,000 square feet by 43,560 square feet gets us approximately 1.147842. So, if the Times Union intended to use 1.15 acres, with 1.5 as a typo, then it is a sign that the TU has to strengthen their proofreading. On a different hand, if 1.5 was used because the writer and proofreader just did not know, then the TU has a bigger problem. Possibly, the writer might have "known" that 1.5 is correct in the same way that Donald Trump "knows" that over 3 million votes cast in November were illegal votes.
No matter what the cause(s) of the error was(were), some people will undoubtedly look at it and claim "no big deal". That is the part that is scary, because what is "no big deal" to you might be a big deal to someone else. This error was an error of 30.68%. Suppose there was an error that big on your tax bill or your car payment or your grocery store checkout or your casino hotel bill? Would that error all of a sudden become a "big deal"?
Sunday, February 5, 2017
Better Value: Teach Well, or Teach Again?
I passed by an algebra class and they were working on exponential functions, they never see it in geometry and then we expect them to remember it in algebra 2. It never happens and we just have to reteach the whole topic from the beginning!!!
The above is quoted from a message submitted by a high school math teacher to a mathematics newsgroup last week. The comment addressed the three fundamentals of education: what do we teach? why do we teach it? and when do we teach it? It also reminded me of the distinction between learning and educating. It seems at times like the "education" fan club forgets how often learning takes place outside of the world of education, and the "self taught" crowd loses sight of how helpful schools can be in guiding an individual's learning.
Mathematics is not unique insofar as how it is learned or how it is taught. Mathematics is unique in how it is perceived. For some crazy reason society places the burden of initial education in mathematics in the hands of elementary teachers. That is not to speak down on elementary teachers. On the contrary.
Consider, for a moment, foreign language education. In most places in out society foreign language instruction is held off until the post-elementary years. Why is that? Most likely it is because of the impression that the typical elementary teacher is not skilled (trained?) adequately to teach a foreign language. We hold off French classes, don't teach Spanish, delay Chinese instruction, and so on because individuals skilled (trained?) to teach them are assigned only to older students in post-elementary years. In some parts of the country there is a push to get these teachers into the elementary schools, where, in isolated instances it was done, and then undone because of budgetary constraints.
Take a moment to recognize that musical instrument instruction has acquired such a respect that most students are taught individually or in small groups by a special instructor. Ever come across an elementary teacher required to teach students how to play the clarinet?
Yet, society operates on the supposition that elementary teachers will have the skills (training?) to instruct in mathematics. The same subject which people disdain with the "I hate math" and "I am no good at math" is being introduced by elementary teachers with no more training in mathematics than they have in any other subject.
Suppose we had a "race to the moon" approach in mathematics education. Imagine placing enough math specialists in elementary schools and adjusting priorities so that students would all leave elementary schools with the solid grounding necessary for handling secondary math. Imagine elementary schools leaving elementary school with a number sense so strong and a spatial perception so good that middle and high school algebra and geometry classes become common-sense subjects to them.
Some students slide through mathematics in school with ease and it can be easy to fall into the trap of saying that all should be able to do it if only they would try harder. Quite often academic success is aided by support the student gets outside of school, and a good learner with some motivation and a good mentor (or sometimes all alone) can succeed even in the absence of a school or teacher. But those are the exceptions, and we should not use them to support a less than adequate system.
Here is part of an article by John A. Dossey from The Arithmetic Teacher from 1984:

Please take note that the issue of improving the teaching of mathematics in elementary schools has been around for a long time. The vast majority of those who were teaching when the article referred to here was published have retired by now. yet the issue still exists.
We have spent at least 35 years recognizing this need and nothing has really changed. Maybe it is time to create a grass-roots movement making the case that any and all students in our society deserve the absolute best we can give them and not accept anything less.
If we were giving the students the absolute best, the scene described in the opening quote here would probably not take place: solid fundamentals create a mind where mathematics makes sense, and if something makes sense, it will be remembered. Plus, if all students were more solidly prepared, the geometry teachers would have the time to incorporate exponential functions into their courses.
Tuesday, January 31, 2017
Home, home on the SPREAD, where the deer and the antelope play....
I truly wish that New York had higher quality exams, as they are intended to be used to measure not only student performance but teacher performance as well.
The analysis continues with question 20 from the January 2017 regents exam in Algebra I (Common Core)

At issue here is choice (2), that refers to the spread of the data. Here, in Algebra I, the word spread should not be used. Spread can be represented many different ways, from range to interquartile range to standard deviation. To the best of my knowledge, standard deviation is not part of the Algebra I knowledge base. Even so, range and interquartile range do not go hand-in-hand: it is possible for a set with a smaller range to have a larger interquartile range.
This choice should most probably have used the word "range" instead of spread. For the record, the ranges are equal in these two sets, but the interquartile ranges are not (7 to 10, or 3 years for soccer players and 9 to 11, or 2 years for basketball players. The standard deviation for soccer is 2.05798 and for basketball is 1.81137. So using range, choice (2) is false, while using the other two measures, choice (2) is true.
Could it be the case that the word "spread' was used when the word "range" should have been used?
Monday, January 30, 2017
New York has to make better tests!

I believe the question needs the word "tsunami" rather than "tidal". The presence of the word "tidal" in this context illustrates the need for improved "proofreading" in the creation of these exams.
Continuing on, here is question 24 from the New York State Geometry (Common Core) regents exam:


Rarely have I seen a water cup used "point up". Let me correct myself: I have never seen a cup used that way. Should a student solve the question as written, they could be perfectly correct and get an answer not listed. That situation should be avoided at all costs on a state exam.
Let's look at question 8 from the January 2017 NY regents exam in Algebra I (Common Core):

I found this question misleading, since the USPS charges 49 cents for up to 1 ounce and 21 cents for each extra ounce or fraction of an ounce. The best mathematical model would be
\({\rm{Cost}} = 49 + 21(w - 1)\)
where w is the weight of the letter in ounces and the costs are measured in cents.
I suspect the question writer was trying to come up with a "real world' application of recursive functions. My advice would be to look again. Question 20 on this test would have made a much better model, as postage must take into account portions of an ounce but mp3 sales would not.
Now comes question 14 from the same Algebra I exam;

The mathematics in this question is basically asking "Which of the following is equal to 6(16)t ?" The rest of the verbiage is due to the attempt to make the problem "real world".
Can't we just ask math questions to test math knowledge?
Sunday, January 29, 2017
Clarification needed!
Here is question 24 from the New York State Algebra II (Common Core) Regents exam from January 2017. Please look at it closely!

Now that you have read it carefully, take note that the domain of this question seems to run from -2 past 5. Also take note that if x is less than 1 or greater than 5, one of the sides must have a negative length. Since lengths cannot be negative, this graph can NOT be a model for the volume of a box, hence the question cannot be answered.
A few thoughts to ponder....
Here is a question from the New York January 2017 Regents Exam in Algebra II (Common Core).
Please read it carefully, then answer some questions below.

2) What do t and P(t) have to do with it?
3) Suppose a student thought as displayed in this chart. Would they get it right?
now
|
5 rabbits
|
in 28 days
|
10 rabbits
|
in 56 days
|
20 rabbits
|
in 84 days
|
40 rabbits
|
in 112 days
|
80 rabbits
|
In 98 days
|
Between 40 and 80
|
On a different note, here is question 21. Read it carefully, then answer a couple questions below.

1) Can you tell me who gets away with no credit card payments for 73 months? Could I stretch it out another 300 months?
2) If this is supposed to be a "real world" question, can you tell me what world that is?
Saturday, January 28, 2017
Technology gives us new ways to look at simple things..
Far too often I hear people talk about how hard math is, which kind of bugs me because math itself is not hard nor easy. It just is. When they say math is hard they are actually referring to their interaction with mathematics. With today's technology, a person's initial contacts with mathematics can and should be drastically different than was even possible even a just a few years ago. I know that many people have a bad taste for math because they spent years in school struggling to tread water while being placed in a depth that was just over their heads. The panacea effect of calculators (which never really helped) was really just a matter of putting flippers on a non-swimmer.
Every once in while I like to take new technology and use it to look for new ways to teach old concepts, hoping to enable beginners to gain a comfort with the shallow water. Even while doing this care must be taken, as one can drown in just an inch of water. Such an attempt is shown here.
This file is nothing more than part of an attempt to enable students to internalize the concept of slope. My goal is to expand this simple file over time so that a path can be blazed that will connect this simple concept with unique slope of a line, slope-intercept equations, parallel lines, right-triangle trigonometry, and more.
Take note that this file requires the viewer to be able to count. Even such a simple item as the "slope formula" is not needed.
This file can be found here.
Wednesday, January 25, 2017
Comparing GeoGebra and Desmos on a Graphing Task
This file I created just as a personal challenge. I make a point to try something new and different every day, and this file I took as a challenge merely because I came across a Desmos version (see it here). I prefer posting with GeoGebra as it seems to give me a bit more control. With GeoGebra I can label items on the graph and have decent control over what appears in different circumstances.
Desmos does a very good job filling the role of graphing calculator, and does it with a much better resolution than the typical handheld calculator. But, I have to be honest, GeoGebra does a lot more. (I should say it can do a whole lot more: it does have a steep learning curve at the start. It is this learning curve that encourages me to push for GeoGebra's use at young ages. A steep slope becomes less steep if it is lengthened. Any ramp user knows that.)
For the moment: I have included in the GeoGebra graph the focus and directrix and a drag-able way of showing the relationship between them and the parabola itself. The equation is also present. I have not found a way of including those features (with labels) in Desmos' embeddable graph. Help me if you can!!
Monday, January 23, 2017
Choosing from 4 wrong answers?
The question below is from the June 2016 Algebra II regents exam in New York. Some questions have been raised about it claiming it might confuse those who are unsure as to how to "count" multiple roots. (For clarity, a multiple root is a crossing root if the root occurs an odd number of times, and a tangent root if it occurs and even number of times.)
Actually, that issue is irrelevant in this question. Based on the accepted standard regarding the meaning of "arrows" at the end of the graph, choice 3 is the only choice satisfying the second and third bulleted items. The first bulleted item is irrelevant in this question.
Or is it? It is possible that choice 3 has at least one root of odd multiplicity of 3 or more, but without a scale on the graph it is impossible to tell.
Or is it? Something did not seem right about choice 3. (Continued below)

I had to do some investigating.
In GeoGebra I created a file including the graphic from choice 3 along with a cubic polynomial graph sharing the x-intercepts with those in choice 3. Since there were no scales on the axes in any of the choices, the only information I could rely on was the relative positions of key points.
Here is the GeoGebra sketch (get it here if you wish):
The dotted blue line marks midway between the leftmost x-intercepts.
No matter what I do to change what is changeable (experiment with changing leading coefficient or absolute position of leftmost root) the polynomials maximum and choice 3's maximum lie on opposite sides of that line.
I will not claim that I have the definitive answer on this issue, but it appears to me that the more you know about cubic polynomial graphs the less likely you are to accept choice 3 as an answer to this question. The problem could have been avoided if actual polynomial graphs had been given.
I believe I understand what the question writers intended with this question, but I must reject the question itself.
Saturday, January 14, 2017
How good is your sense of time?
This GeoGebra creation is the result of a discussion involving the "hang time" of a kick in one of the NFL playoff games. The thought smashed into my head later when I heard someone say something like "I don't know how long it was, but it felt like hours".
This is a simple creation (original available here). The duration ranges from 3 seconds to 15 seconds.
This is a simple creation (original available here). The duration ranges from 3 seconds to 15 seconds.
Tuesday, January 10, 2017
Triangle of Time
Sometimes GeoGebra spurs me on to a new way of looking at something old and familiar.
In this case, a clock. Yesterday I posted the clock I made in GeoGebra. Today I have tweaked it a bit to help pose a question.
The three hands are all pointing to 3 points on the circumference of the circle. These 3 points form a triangle. Can we work with the area of that circle?
1) The smallest area of the circle is zero. How often does that happen in a 12 hour time span?
2) What is the largest area? How often does that happen in 12 hours?
A stretch for trig or precalculus students might be generating a graph of the area as a function of time of day. A stretch for calculus students might involve determining exactly when the area is largest by maximizing that function.
A stretch for younger students might be generating this graph on their own. It is too bad that the politics of education make it virtually impossible for a math teacher to take time to work with students on questions like these.
I suspect textbook publishers do not like questions such as this!
Monday, January 9, 2017
Can you build a clock?
Many of us take clocks for granted, but there is not a simple clock anywhere. behind every timepiece is a great deal of mathematics together with either metallurgy or engineering or chemistry or electronics or programming, or maybe all of those!
Here is a basic dial clock made totally within GeoGebra.
GeoGebra does have a feature that allows it to read the time off of your computer, but what happens then is whatever you do with it.
Here is a basic dial clock made totally within GeoGebra.
GeoGebra does have a feature that allows it to read the time off of your computer, but what happens then is whatever you do with it.
Friday, January 6, 2017
Focus, Directrix, and Conics
Back in the classroom I used to wish I had a better way to demonstrate the focus-directrix connections between the conics. The algebraic methods were time-consuming and, I know, contributed to "brain stoppage" by many students. Pencil and paper constructions, taken to a useful stage, would have taken days and days. If only there was a better way...
GeoGebra helped me begin to bridge that gap. My first go at it has produced the file here. Not perfect, but a lot better than what I had before. Check it out and EXPERIMENT!!!
Unfortunately, making this fit in the blog requires it to be tiny. Click here for full version
Subscribe to:
Posts (Atom)